
Page 4 - Predictive.indd
P. 4
Predictive Analytics Simple Economics Relative Probabilities Well Planning
Time / Asset Development * Least Likely Case Most Likely Case
Net Cashflow + Below TC
conducive reservoir
3D numerous production predictive Frequency
seismic lateral monitoring production Above TC
& well log completions (IP90/ analytics
data IP180) shorter payout for average well payout On TC
0
Time
non-conducive reservoir
are some
what criteria wells what areas longer payout for
determines producing will produce
where to better than best?
drill? 0% Relative Probability 100%
others?
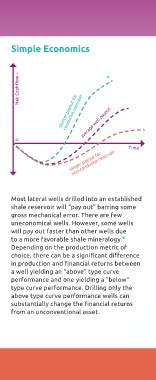
Most lateral wells drilled into an established For any planned location, the type curve Once a predictive analytic production
action shale reservoir will “pay out” barring some classification (above, on or below type metric model is constructed, well paths
Modified from predictiveanalyticstoday.com gross mechanical error. There are few curve) statistic can be extracted and used through any bench or landing zone can
uneconomical wells. However, some wells to determine well feasibility and/or priority. be analyzed and production metric
With unconventional shale reservoirs, will pay out faster than other wells due In addition to the classification, a relative classification or probability of class can
a predictive model can be built with to a more favorable shale mineralogy.* probability statistic is also extracted for be measured. Type curve probability
production monitoring from numerous Depending on the production metric of each type curve class. The statistics above measurements can be reviewed and well
lateral wells and extensive 3D seismic choice, there can be a significant difference show that this location has a very strong paths optimized to maximize IP90 or IP180
coverage. The predictive production in production and financial returns between probability of being an above type curve yields.
metric model identifies the best producing a well yielding an “above” type curve producer, and is less likely to be a below
areas within an asset, and an integrated, performance and one yielding a “below” type curve producer. A relative probability of on type curve
intelligent, in-fill drilling plan developed type curve performance. Drilling only the performance is shown above. This
to provide the best financial returns for above type curve performance wells can Measurements such as this are performed validation well shows the toe of the well
the asset. substantially change the financial returns on an out-of-sample or blind population to path having a high probability (bright
from an unconventional asset. test the robustness of the predictive model, colors) of on type curve performance. The
and to predict potential returns based on heel of the well has a high probability of
previous production and returns. above type curve performance (not shown).